

Everybody should be trying to prepare for retirement, regardless of how long or short their career has been. For the majority of people the city and country in which they live will have a large impact on their lifestyle once they reach retirement age.
A new study by Audley Villages reveals the city in which people are most prepared for retirement. By looking into a variety of metrics, including retirement age, government pension initiatives and health grade of the 37 OECD countries and capital cities, the luxury retirement village developer reveals how retirement planning varies around the world.
______________________________
STUDY REVEALS SPAIN IS THE COUNTRY WHERE CITIZENS ARE MOST PREPARED FOR RETIREMENT
______________________________
Coming in first place, people living in Spain will enjoy the second longest retirement of 22 years on average. Spain has one of the youngest retirement ages at 61 years, yet a long life expectancy of nearly 84 years on average. The country is also in the top 10 when it comes to pensions, with the average pension being 83.4% of a person’s pre-retirement earnings. Spain also boasts the highest health grade - a metric that looks into health risks, availability of clean water, malnutrition and causes of death - meaning retirees are assured they will be looked after as they grow older.
Greece, in second place, has the second lowest retirement age at 60, meaning those planning to retire can expect nearly 22 years of retirement living. The country doesn’t score very well when it comes to financial aid however, with a lower pension offering than many other countries at just 51.1% of pre-retirement earning. A low cost of living and the highest number of GP’s per 1,000 population helps the country take the second place.
Third placed Austria also boasts the fourth highest pension offering, at 89.9% of an individual's pre-retirement earnings. With the average retirement being nearly 20 years long, Austrians are well prepared when it comes to saying farewell to their working days.
|
Country |
Overall Ranking |
Average Retirement Age |
Average Life Expectancy |
Pension % of pre-retirement earnings |
Average annual investment rates of return of retirement savings plans |
Health Grade |
Number of doctors per 1,000 population |
|
Spain |
1 |
61.7 |
83.99 |
83.4 |
2.6 |
92.75 |
4.02 |
|
Greece |
2 |
60.85 |
82.8 |
51.1 |
5.1 |
82.29 |
6.3 |
|
Austria |
3 |
62.15 |
82.05 |
89.9 |
3.4 |
86.3 |
5.24 |
|
Italy |
4 |
62.4 |
84.01 |
91.8 |
2.3 |
91.59 |
4.02 |
|
Luxembourg |
5 |
60.9 |
82.79 |
90.1 |
2.5 |
87.39 |
2.98 |
|
Netherlands |
6 |
63.85 |
82.78 |
80.2 |
6.3 |
85.86 |
3.61 |
|
Belgium |
7 |
61.05 |
82.17 |
66.2 |
5.1 |
80.46 |
3.13 |
|
Norway |
8 |
65.1 |
82.94 |
51.6 |
5.4 |
89.09 |
4.93 |
|
France |
9 |
60.8 |
83.13 |
73.6 |
N/A |
86.94 |
3.37 |
|
Portugal |
10 |
66.95 |
82.65 |
89.6 |
3 |
83.1 |
5.12 |
|
Slovenia |
11 |
61.6 |
81.85 |
57.5 |
4.2 |
82.72 |
3.18 |
|
Finland |
12 |
63.85 |
82.48 |
64.2 |
5.4 |
85.89 |
3.81 |
|
Australia |
13 |
64.8 |
83.94 |
41 |
7.7 |
89.75 |
3.75 |
|
Germany |
14 |
63.8 |
81.88 |
51.9 |
3.5 |
83.06 |
4.31 |
|
Canada |
15 |
64.75 |
82.69 |
50.7 |
6.5 |
85.7 |
2.8 |
|
Iceland |
16 |
67 |
83.52 |
69.8 |
7.5 |
91.44 |
3.93 |
|
Denmark |
17 |
63.8 |
81.4 |
70.9 |
4.7 |
82.69 |
4.19 |
|
Ireland |
18 |
64.85 |
82.81 |
35.9 |
6.5 |
84.06 |
3.34 |
|
Czech Republic |
19 |
62.25 |
79.85 |
60.3 |
0.9 |
77.59 |
4.04 |
|
Hungary |
20 |
61.7 |
77.31 |
84.3 |
5.1 |
64.43 |
3.38 |
|
Sweden |
21 |
65.9 |
83.33 |
53.4 |
N/A |
90.24 |
4.27 |
|
Switzerland |
22 |
65.7 |
84.25 |
44.3 |
3.8 |
90.93 |
4.34 |
|
Turkey |
23 |
65.6 |
78.45 |
93.8 |
10.9 |
62.81 |
1.88 |
|
Poland |
24 |
61.7 |
79.27 |
35.1 |
1.6 |
70.25 |
2.38 |
|
United Kingdom |
25 |
64.15 |
81.77 |
28.4 |
N/A |
84.28 |
2.95 |
|
Israel |
26 |
67.7 |
83.49 |
57.8 |
5.2 |
88.15 |
3.22 |
|
Estonia |
27 |
65.6 |
79.18 |
53.1 |
2.9 |
73.32 |
3.48 |
|
New Zealand |
28 |
68.1 |
82.8 |
42.8 |
N/A |
85.06 |
3.35 |
|
United States |
29 |
67.2 |
79.11 |
49.4 |
4 |
73.02 |
2.61 |
|
Japan |
30 |
69.95 |
85.03 |
36.8 |
N/A |
91.38 |
2.49 |
|
Lithuania |
31 |
63.65 |
76.41 |
31 |
3.7 |
N/A |
4.6 |
|
Chile |
32 |
68.35 |
80.74 |
37.3 |
6.9 |
73.21 |
2.59 |
|
Mexico |
33 |
68.9 |
75.41 |
28.6 |
5 |
62.09 |
2.44 |
|
Latvia |
34 |
65.2 |
75.73 |
54.3 |
2.4 |
N/A |
3.3 |
|
South Korea |
35 |
N/A |
83.5 |
43.4 |
N/A |
85.41 |
2.39 |
|
Colombia |
36 |
65.9 |
77.87 |
N/A |
8 |
N/A |
2.18 |
|
Slovakia |
37 |
N/A |
78 |
65.1 |
N/A |
N/A |
3.52 |
______________________________
VIENNA IS THE CITY SECOND MOST PREPARED FOR RETIREMENT
______________________________
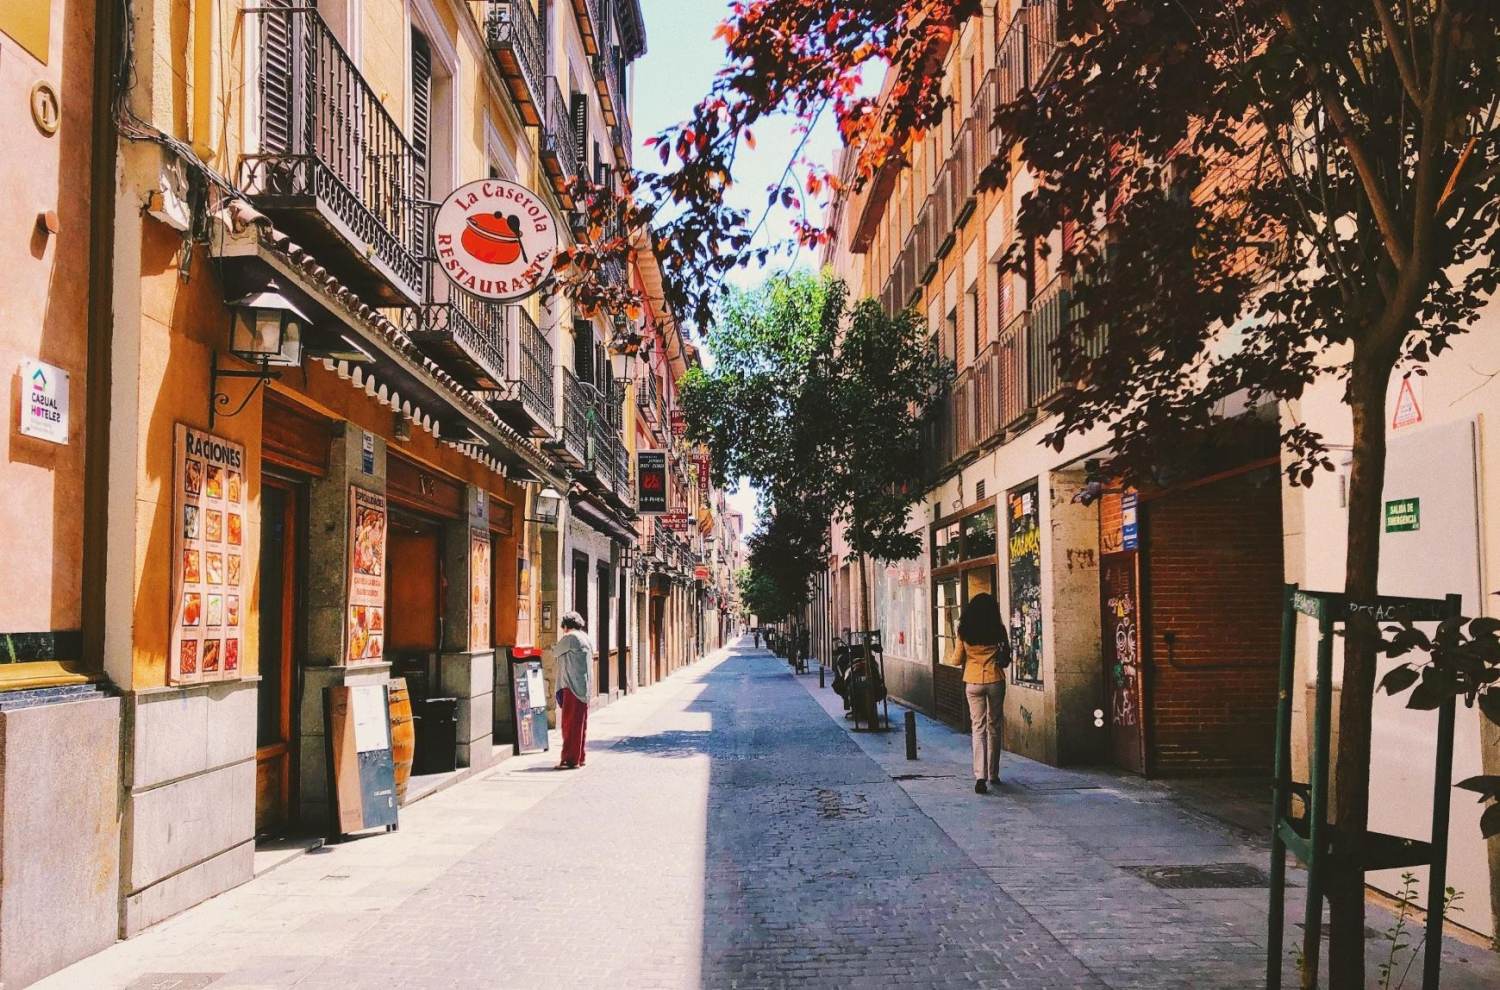
Madrid takes the crown as the city in which retirees are most prepared for their retirement. Despite Greece beating Austria in the overall countries ranking, Vienna beats Athens to second place when looking at city specific metrics. Cheaper property prices and a better savings regime helps boost Vienna into second place behind Madrid.
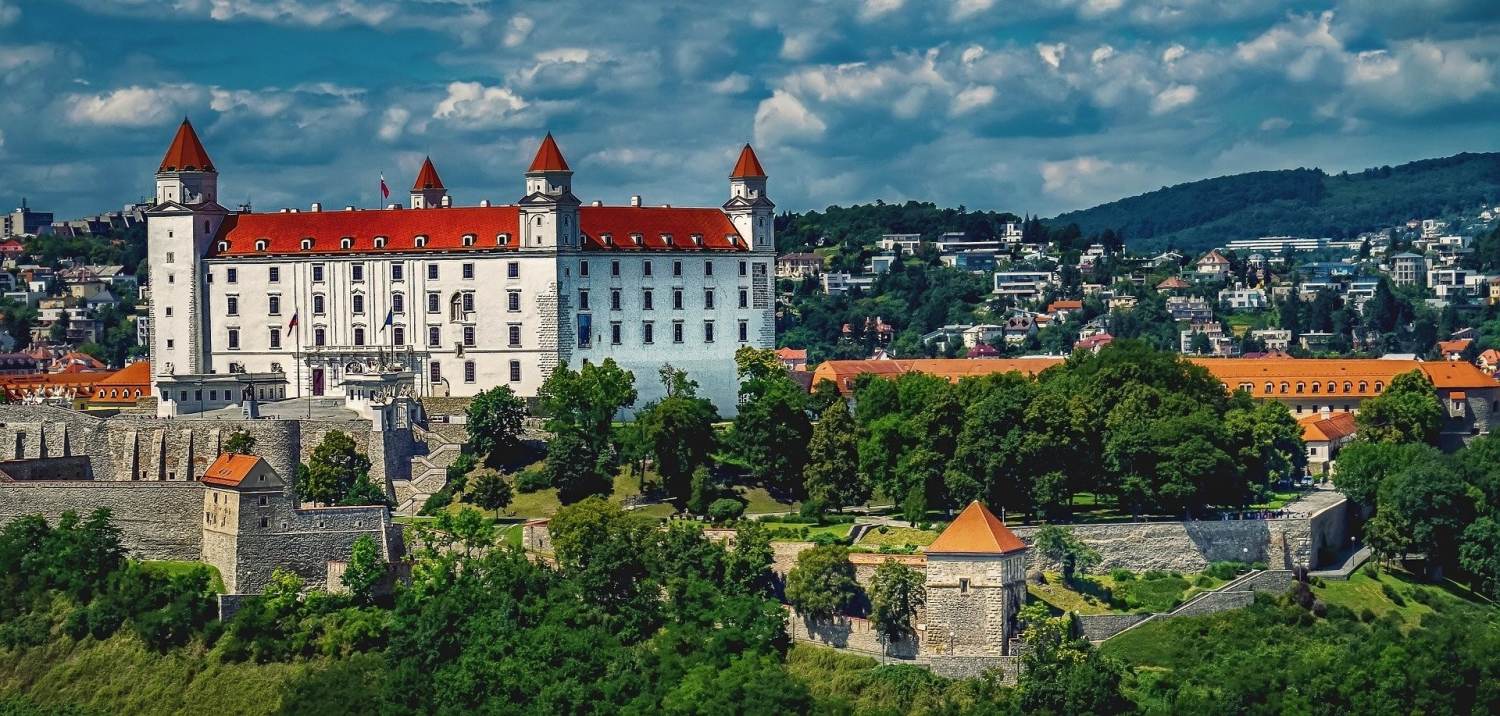
Bratislava, Slovakia comes in bottom place with one of the lowest life expectancies at 78 years. It also has one of the smallest retirement communities with just 40,677 people over the age of 65.
Despite having the largest population of over 65’s, at 2,929,678, Mexico City can be found at the bottom end of the table and has been named as the 35th city most prepared for retirement. It has the second highest retirement age of 68 and the third lowest average annual salary ($7,368.23). Even the high percentage of disposable income put into savings (14.69%) cannot increase Mexico City’s position.
|
City |
Country |
Ranking |
Number of citizens 65+ |
Average Length of Retirement |
% of household disposable income put into savings |
Property Price per square metre ($) |
Three Course meal for two people ($) |
Fitness Club monthly fee for 2 adults ($) |
|
Madrid |
Spain |
1 |
339,583 |
22.29 |
2.01 |
6,130.99 |
59.53 |
95.24 |
|
Vienna |
Austria |
2 |
156,168 |
19.9 |
8.23 |
9,065.23 |
59.29 |
65.26 |
|
Athens |
Greece |
3 |
160,981 |
21.95 |
-11.55 |
1,944.44 |
47.43 |
62.54 |
|
Rome |
Italy |
4 |
192,566 |
21.61 |
2.55 |
8,191.94 |
71.04 |
148.86 |
|
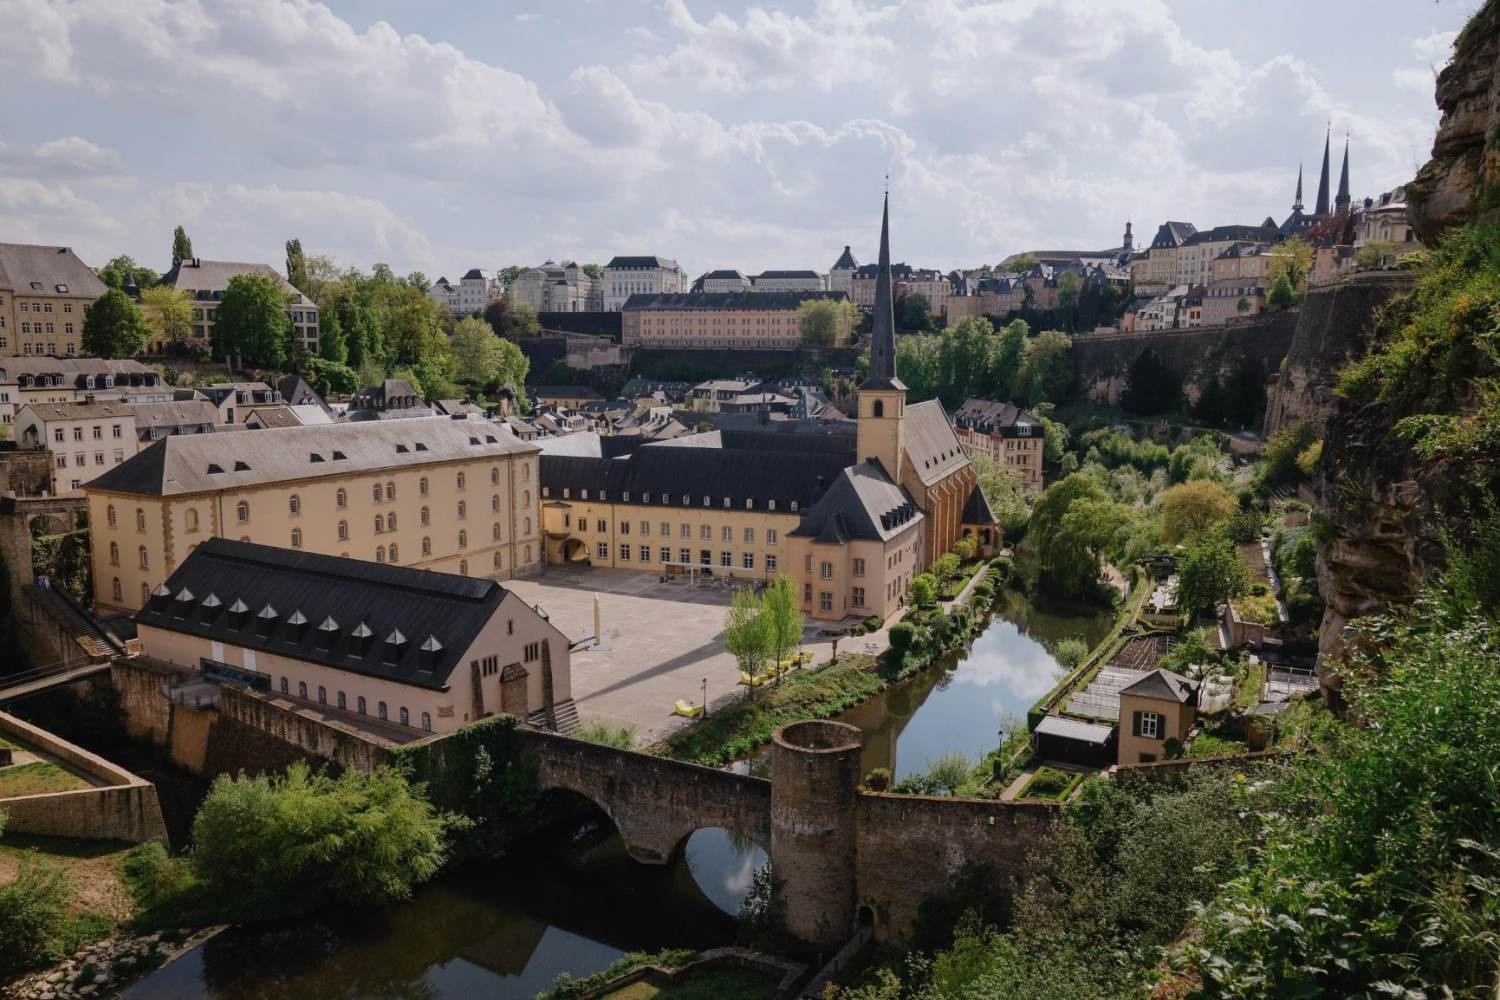
Luxembourg City |
Luxembourg |
5 |
8,515 |
21.89 |
15.99 |
12,976.65 |
83 |
113.61 |
|
Amsterdam |
Netherlands |
6 |
138,455 |
18.93 |
10.01 |
8,830.78 |
88.93 |
98.38 |
|
Brussels |
Belgium |
7 |
139,992 |
21.12 |
6.24 |
4,091.90 |
71.14 |
76.66 |
|
Lisbon |
Portugal |
8 |
135,289 |
15.7 |
-2.19 |
5,248.27 |
41.5 |
76.04 |
|
Paris |
France |
9 |
112,067 |
22.33 |
9.11 |
15,301.15 |
71.14 |
88.7 |
|
Oslo |
Norway |
10 |
81,210 |
17.84 |
6.52 |
10,177.01 |
105.67 |
101.72 |
|
Sydney |
Australia |
11 |
326,896 |
19.14 |
10.26 |
10,577.43 |
77.38 |
126.53 |
|
Ljubljana |
Slovenia |
12 |
27,128 |
20.25 |
6 |
4,409.18 |
47.43 |
101.38 |
|
Helsinki |
Finland |
13 |
67,734 |
18.63 |
0.39 |
9,661.44 |
85.38 |
94.86 |
|
Berlin |
Germany |
14 |
239,062 |
18.08 |
10.87 |
7,386.94 |
59.53 |
74.37 |
|
Copenhagen |
Denmark |
15 |
39,706 |
17.6 |
3.68 |
7,695.73 |
107.63 |
89.36 |
|
Reykjavik |
Iceland |
16 |
7,667 |
16.52 |
N/A |
4,703.49 |
120.92 |
113.1 |
|
Toronto |
Canada |
17 |
409,098 |
17.94 |
1.24 |
9,166.05 |
71.16 |
88.5 |
|
Budapest |
Hungary |
18 |
148,903 |
15.61 |
6.32 |
3,354.82 |
38.98 |
84.24 |
|
Prague |
Czech Republic |
19 |
110,802 |
17.6 |
7.63 |
6,231.55 |
36.27 |
85.6 |
|
Dublin |
Ireland |
20 |
138,495 |
17.96 |
7.51 |
6,565.00 |
81.82 |
94.88 |
|
Stockholm |
Sweden |
21 |
115,407 |
17.43 |
16.02 |
11,452.07 |
93.35 |
105.8 |
|
Bern |
Switzerland |
22 |
22,104 |
18.55 |
16.17 |
8,460.31 |
106.88 |
184.06 |
|
Ankara |
Turkey |
23 |
605,003 |
12.85 |
N/A |
742.19 |
15.64 |
44.19 |
|
Jerusalem |
Israel |
24 |
77,250 |
15.79 |
N/A |
9,502.01 |
89.91 |
182.59 |
|
Tallinn |
Estonia |
25 |
22,010 |
13.58 |
9.6 |
3,314.64 |
59.29 |
111.63 |
|
Warsaw |
Poland |
26 |
176,714 |
17.57 |
1.43 |
4,195.38 |
38.69 |
62.25 |
|
London |
United Kingdom |
27 |
654,464 |
17.62 |
0.74 |
15,276.81 |
63.25 |
70.2 |
|
Wellington |
New Zealand |
28 |
13,444 |
14.7 |
-0.32 |
5,297.39 |
64.13 |
76.81 |
|
Tokyo |
Japan |
29 |
1,293,979 |
15.08 |
4.29 |
11,677.39 |
45.81 |
176.65 |
|
Santiago |
Chile |
30 |
630,405 |
12.39 |
9.61 |
2,701.18 |
47.54 |
76.69 |
|
Vilnius |
Lithuania |
31 |
35,014 |
12.76 |
0.62 |
3,356.41 |
47.43 |
69.32 |
|
Washington |
United States |
32 |
569,697 |
11.91 |
7.96 |
7,099.65 |
80.03 |
159.67 |
|
Bogota |
Colombia |
33 |
797,941 |
11.98 |
8.16 |
1,840.99 |
21.99 |
49.38 |
|
Seoul |
South Korea |
34 |
1,587,366 |
N/A |
7.07 |
19,087.65 |
43.82 |
110.97 |
|
Mexico City |
Mexico |
35 |
2,929,678 |
6.51 |
14.69 |
2,293.09 |
36.11 |
96.56 |
|
Riga |
Latvia |
36 |
46,630 |
10.53 |
-3.04 |
2,418.02 |
47.62 |
87.49 |
|
Bratislava |
Slovakia |
37 |
40,677 |
N/A |
4.55 |
4,382.71 |
41.5 |
66.56 |
______________________________
INDIVIDUALS ARE MOST FINANCIALLY PREPARED FOR RETIREMENT IN LUXEMBOURG
______________________________
To rank how financially prepared individuals are in specific countries and cities, we looked at a number of metrics. These include average yearly income, personal pension in comparison to their pre-retirement earnings, the average percentage of disposable income put into savings, annual investment rates of return of retirement savings plans and the percentage of individuals who own their own property.
Luxembourg sits in first position and is the country with the third highest average yearly income, at $73,910. Retirees enjoy 90.1% of their pre-retirement earnings as their pension - the third highest of any other country. People who live in Luxembourg are prepared for a long and comfortable retirement with nearly 16% of their yearly income being put into savings.
Hungary, in fourth place, has the highest percentage of citizens who own their own properties, at 91.7%. This means retirees are able to stay in their own home for longer and have the reassurance of using equity for a cash influx if they need it.
Switzerland comes in nineth place despite having the best saving habits out of all OECD countries. An average of 16.17% of all household disposable income is put into savings, meaning Swiss people can plan ahead and be financially comfortable when heading into retirement.
|
Country |
Ranking |
Average yearly income ($) |
Pension % of pre-retirement earnings |
% of household disposable income put into savings |
Average annual investment rates of return of retirement savings plans |
% of individuals who own their own property |
|
Luxembourg |
1 |
73,910.00 |
90.1 |
15.99 |
2.5 |
71.2 |
|
Norway |
2 |
82,500.00 |
51.6 |
6.52 |
5.4 |
81.3 |
|
Netherlands |
3 |
53,100.00 |
80.2 |
10.01 |
6.3 |
69 |
|
Hungary |
4 |
16,500.00 |
84.3 |
6.32 |
5.1 |
91.7 |
|
Ireland |
5 |
64,000.00 |
35.9 |
7.51 |
6.5 |
70.3 |
|
Belgium |
6 |
48,030.00 |
66.2 |
6.24 |
5.1 |
72.3 |
|
Denmark |
7 |
63,950.00 |
70.9 |
3.68 |
4.7 |
60.8 |
|
Iceland |
8 |
72,850.00 |
69.8 |
N/A |
7.5 |
74.1 |
|
Switzerland |
9 |
85,500.00 |
44.3 |
16.17 |
3.8 |
43.4 |
|
United States |
10 |
65,850.00 |
49.4 |
7.96 |
4 |
65.3 |
|
Austria |
11 |
51,460.00 |
89.9 |
8.23 |
3.4 |
55.2 |
|
Finland |
12 |
50,010.00 |
64.2 |
0.39 |
5.4 |
71.1 |
|
Italy |
13 |
34,530.00 |
91.8 |
2.55 |
2.3 |
72.4 |
|
Australia |
14 |
55,100.00 |
41 |
10.26 |
7.7 |
65.5 |
|
Canada |
15 |
46,370.00 |
50.7 |
1.24 |
6.5 |
66.3 |
______________________________
BRATISLAVA HAS THE CHEAPEST LIFESTYLE FOR RETIREES
______________________________
Despite ranking lowest overall when looking at retirement readiness, Bratislava scores consistently well when it comes to the price of property, fitness club memberships and the price of a three course meal - making it the cheapest city when it comes to retirement living. 91.3% of individuals in Bratislava own their own property which helps give financial security. A couple will spend around $41.50 for a meal out and around $66.56 for joint monthly fitness club fees.
Although Ankara in Turkey boasts the cheapest property prices at $742.19 per square metre, 41% of the population do not own their own home. Ankara is also the cheapest city for retirees to enjoy a three course meal, with a couple needing to pay just $15.64 to enjoy a three-course meal at a mid-range restaurant.
|
Capital City |
Country |
Ranking |
% of individuals who own their own property |
Property Price per square metre ($) |
Three Course meal for two people ($) |
Fitness Club monthly fee for 2 adults ($) |
|
Bratislava |
Slovakia |
1 |
91.3 |
4,382.71 |
41.5 |
66.56 |
|
Budapest |
Hungary |
2 |
91.7 |
3,354.82 |
38.98 |
84.24 |
|
Vilnius |
Lithuania |
3 |
89.9 |
3,356.41 |
47.43 |
69.32 |
|
Ankara |
Turkey |
4 |
59 |
742.19 |
15.64 |
44.19 |
|
Warsaw |
Poland |
5 |
84.2 |
4,195.38 |
38.69 |
62.25 |
|
Athens |
Greece |
6 |
75.4 |
1,944.44 |
47.43 |
62.54 |
|
Mexico City |
Mexico |
7 |
80 |
2,293.09 |
36.11 |
96.56 |
|
Riga |
Latvia |
8 |
80.2 |
2,418.02 |
47.62 |
87.49 |
|
Prague |
Czech Republic |
9 |
78.6 |
6,231.55 |
36.27 |
85.6 |
|
Lisbon |
Portugal |
10 |
74.5 |
5,248.27 |
41.5 |
76.04 |
|
Tallinn |
Estonia |
11 |
81.7 |
3,314.64 |
59.29 |
111.63 |
|
Ljubljana |
Slovenia |
12 |
74.8 |
4,409.18 |
47.43 |
101.38 |
|
Bogota |
Colombia |
13 |
N/A |
1,840.99 |
21.99 |
49.38 |
|
Brussels |
Belgium |
14 |
72.3 |
4,091.90 |
71.14 |
76.66 |
|
Madrid |
Spain |
15 |
76.2 |
6,130.99 |
59.53 |
95.24 |
______________________________
THE UNITED KINGDOM RANKS 25TH OVERALL
______________________________

Coming in the bottom half of the overall countries table, in 25th place, it seems the United Kingdom has more to do to change perceptions and to ensure its citizens are fully prepared for retirement.
Around 3,572,948 British people are over the age of 65 - the seventh highest number of all countries studied. Unfortunately, British retirees have the second lowest pension compared with other countries studied, with the state pension being just 3.7% of their pre-retirement earnings and overall pension averaging 28.4% of pre-retirement earnings.
Overall, 37% of Brits do not own their own home - the seventh highest country.
|
Number of citizens 65+ |
3,572,948.00 |
|
Average Retirement Age |
64.15 |
|
Average Life Expectancy |
81.77 |
|
Average Length of Retirement |
17.62 |
|
Average yearly income ($) |
42,220.00 |
|
Pension % of pre-retirement earnings |
28.40 |
|
% of household disposable income put into savings |
0.74 |
|
Average annual investment rates of return of retirement savings plans |
N/A |
|
% of individuals who own their own property |
63.00 |
|
Property Price per square metre ($) |
4,178.21 |
|
Three Course meal for two people ($) |
73.69 |
|
Fitness Club monthly fee for 2 adults ($) |
81.79 |
|
Health Grade |
84.28 |
|
Number of doctors per 1,000 population |
2.95 |
______________________________
SOURCES AND METHODOLOGY
______________________________
To reveal our findings we created a weighted index looking at 14 different metrics, focussing on key areas including health, financial planning, cost of living and property. The 37 OECD countries, and their respective main cities, were then measured against the metrics, with a different score awarded depending on the findings. Each score was combined to reveal one final score. The higher the score, the more prepared for retirement the country and city was deemed.
• worldpopulationreview.com
• data.oecd.org
• en.wikipedia.org
• numbeo.com
• worlddata.info
• statista.com
• averagesalarysurvey.com
• destinationscanner.com
• salaryexplorer.com
• worldometers.info
• euro.who.int
• aihw.gov.au
• data.worldbank.org
• knoema.com
• tradingeconomics.com
• stats.oecd.org


